|
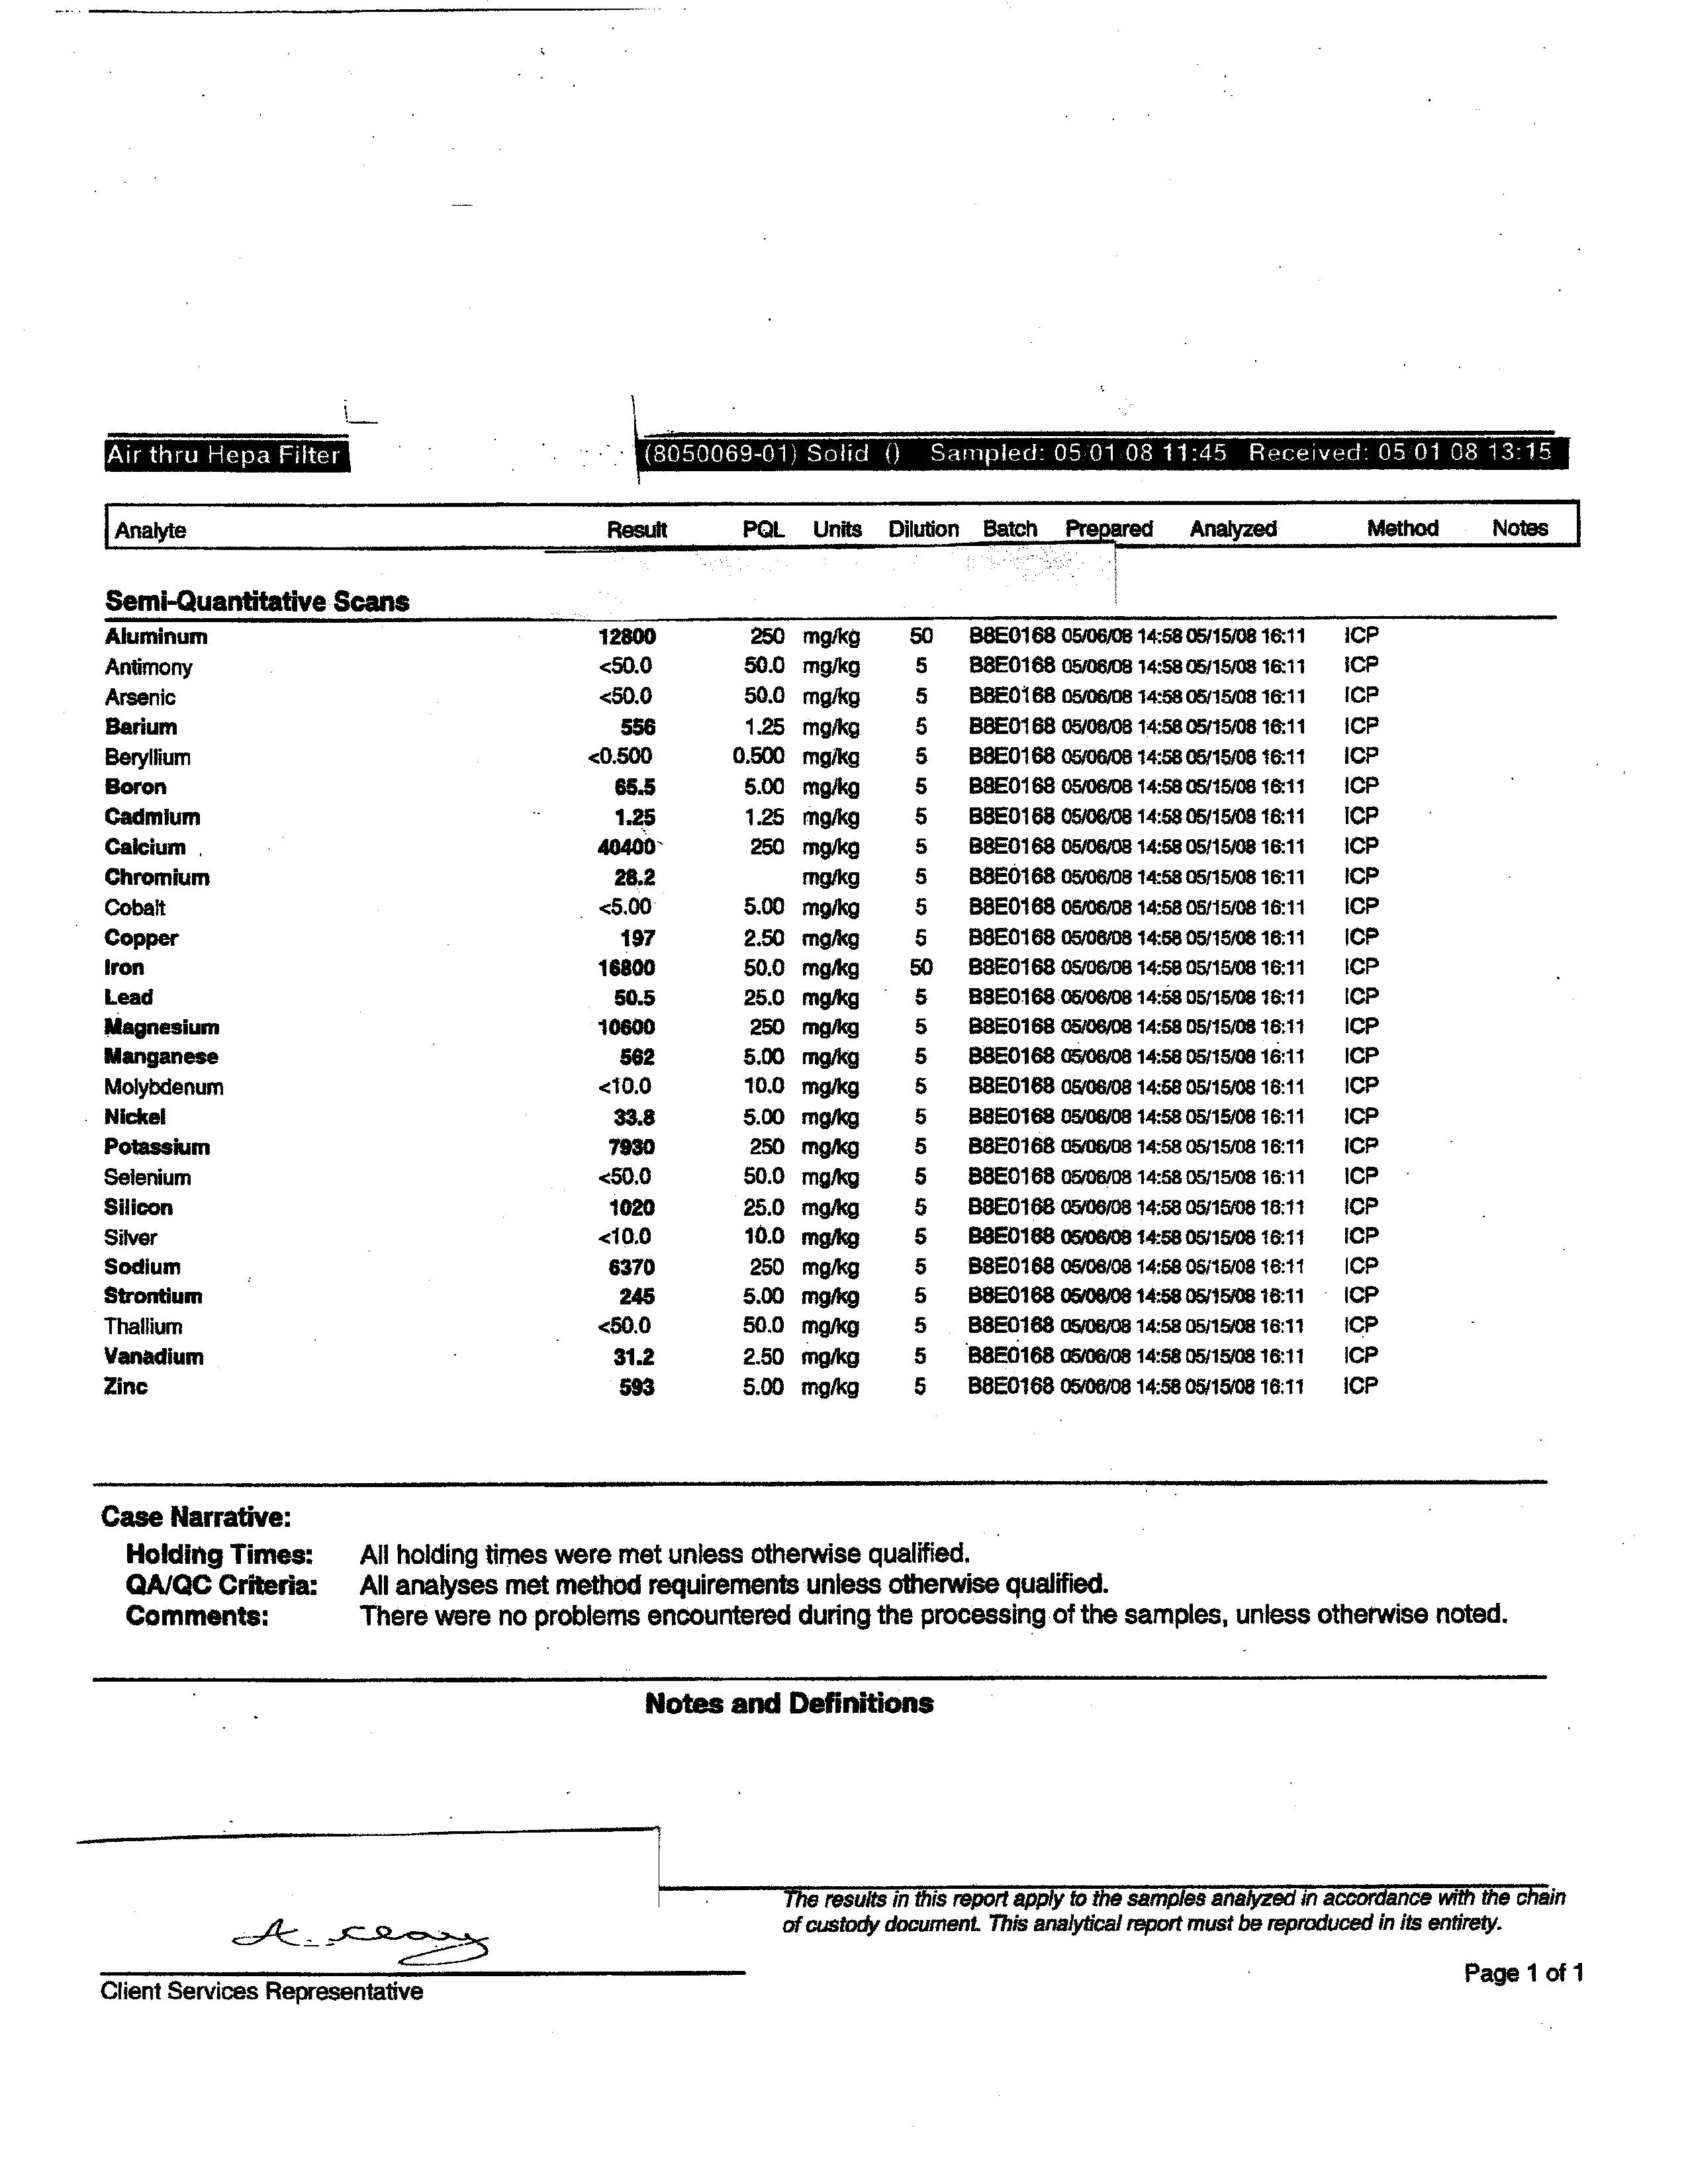
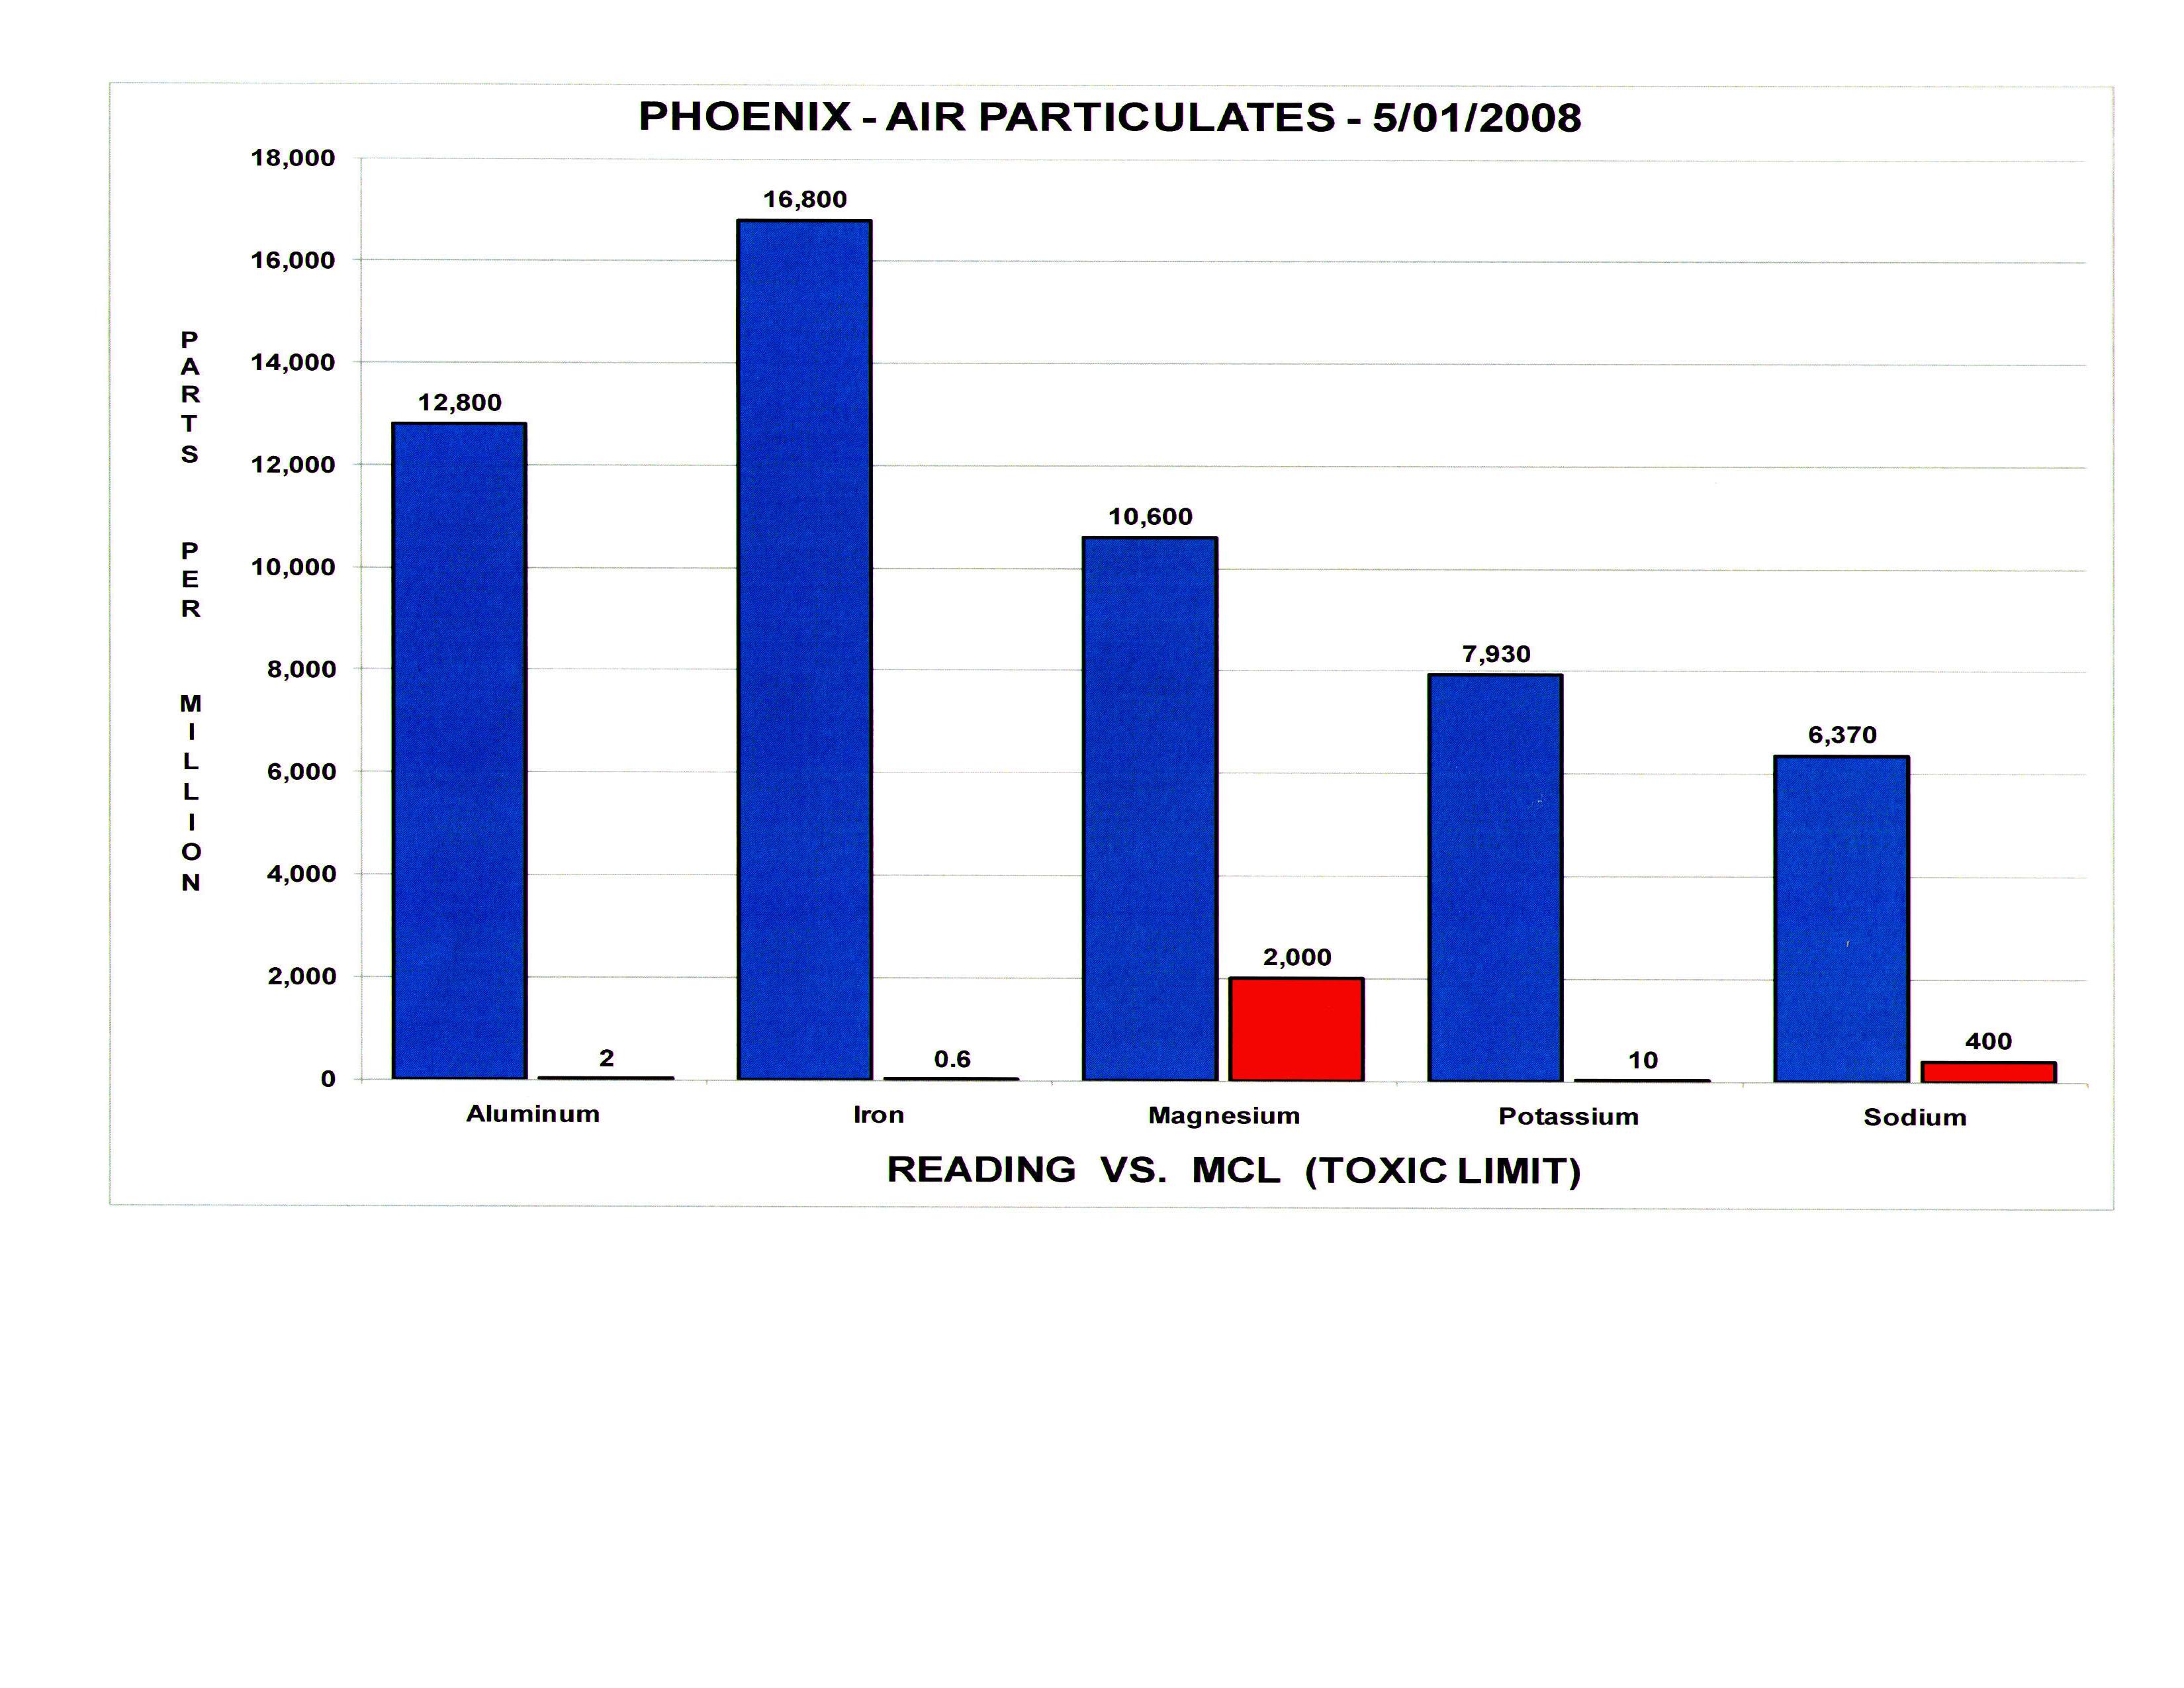
Phoenix Air Particulates Lab Report - 2008
Here are pictures of some of these readings, comparing them to the Maximum
Contaminant Levels, or toxic limits,
|
|
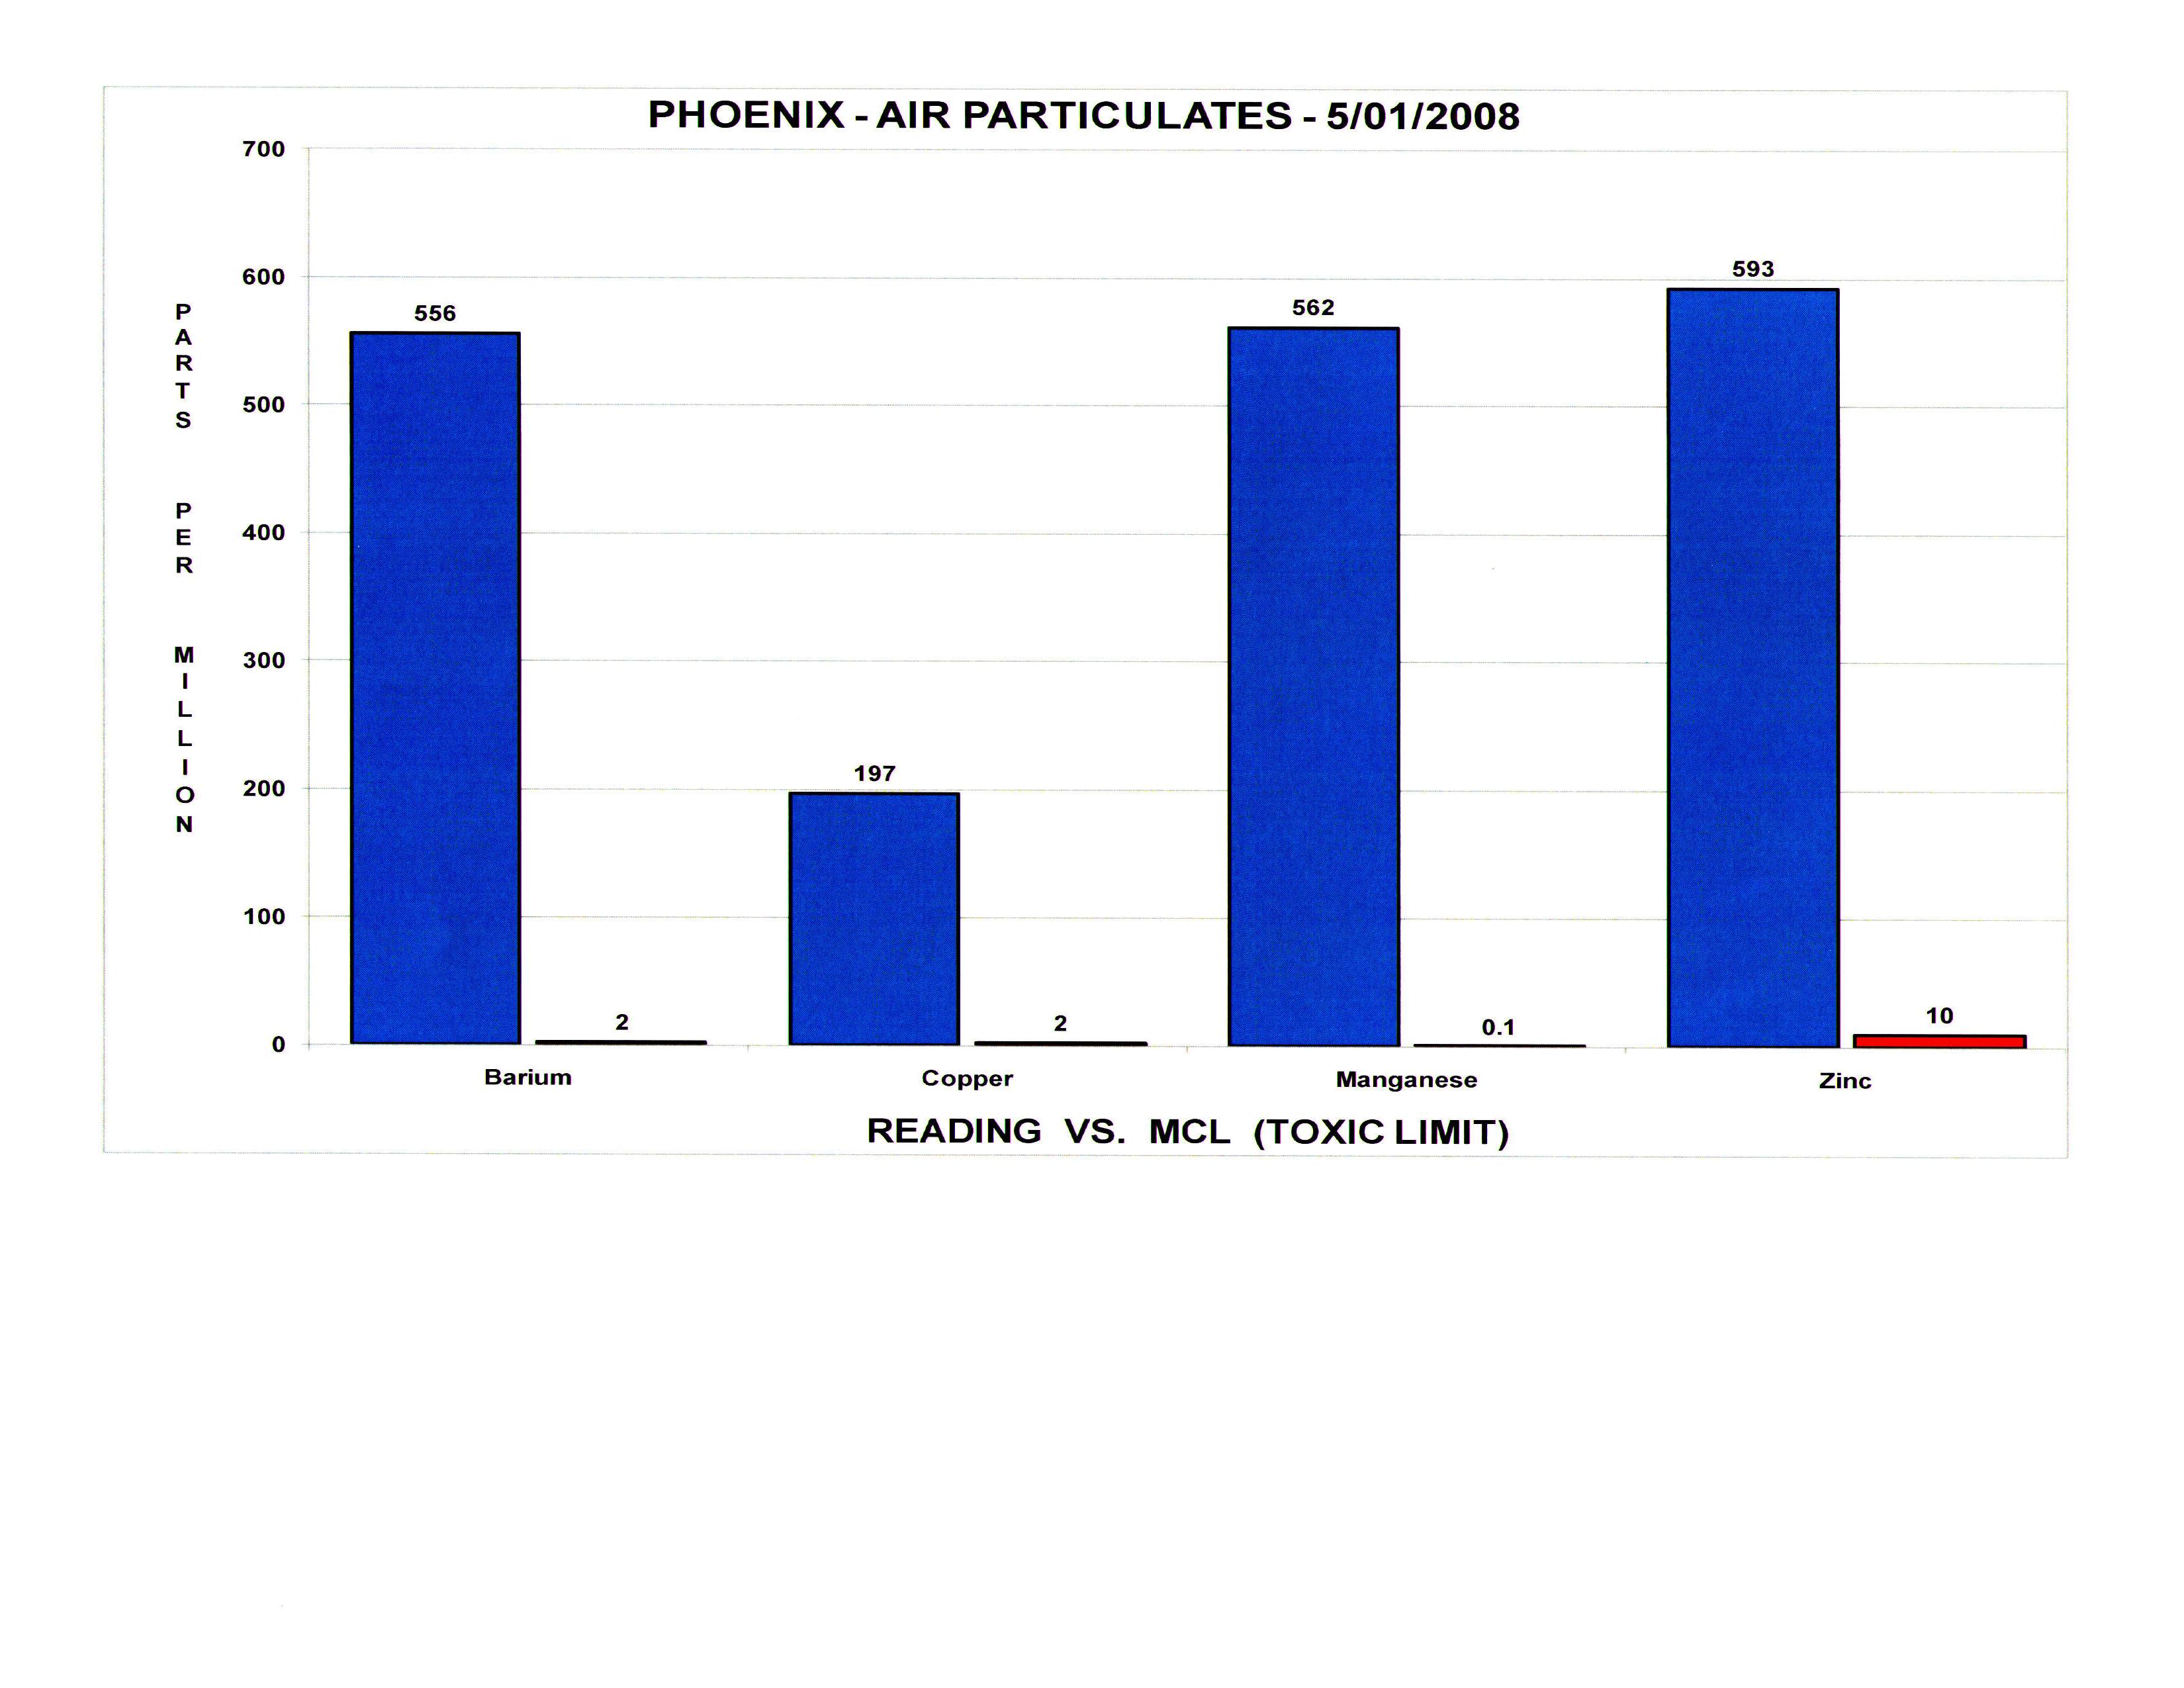
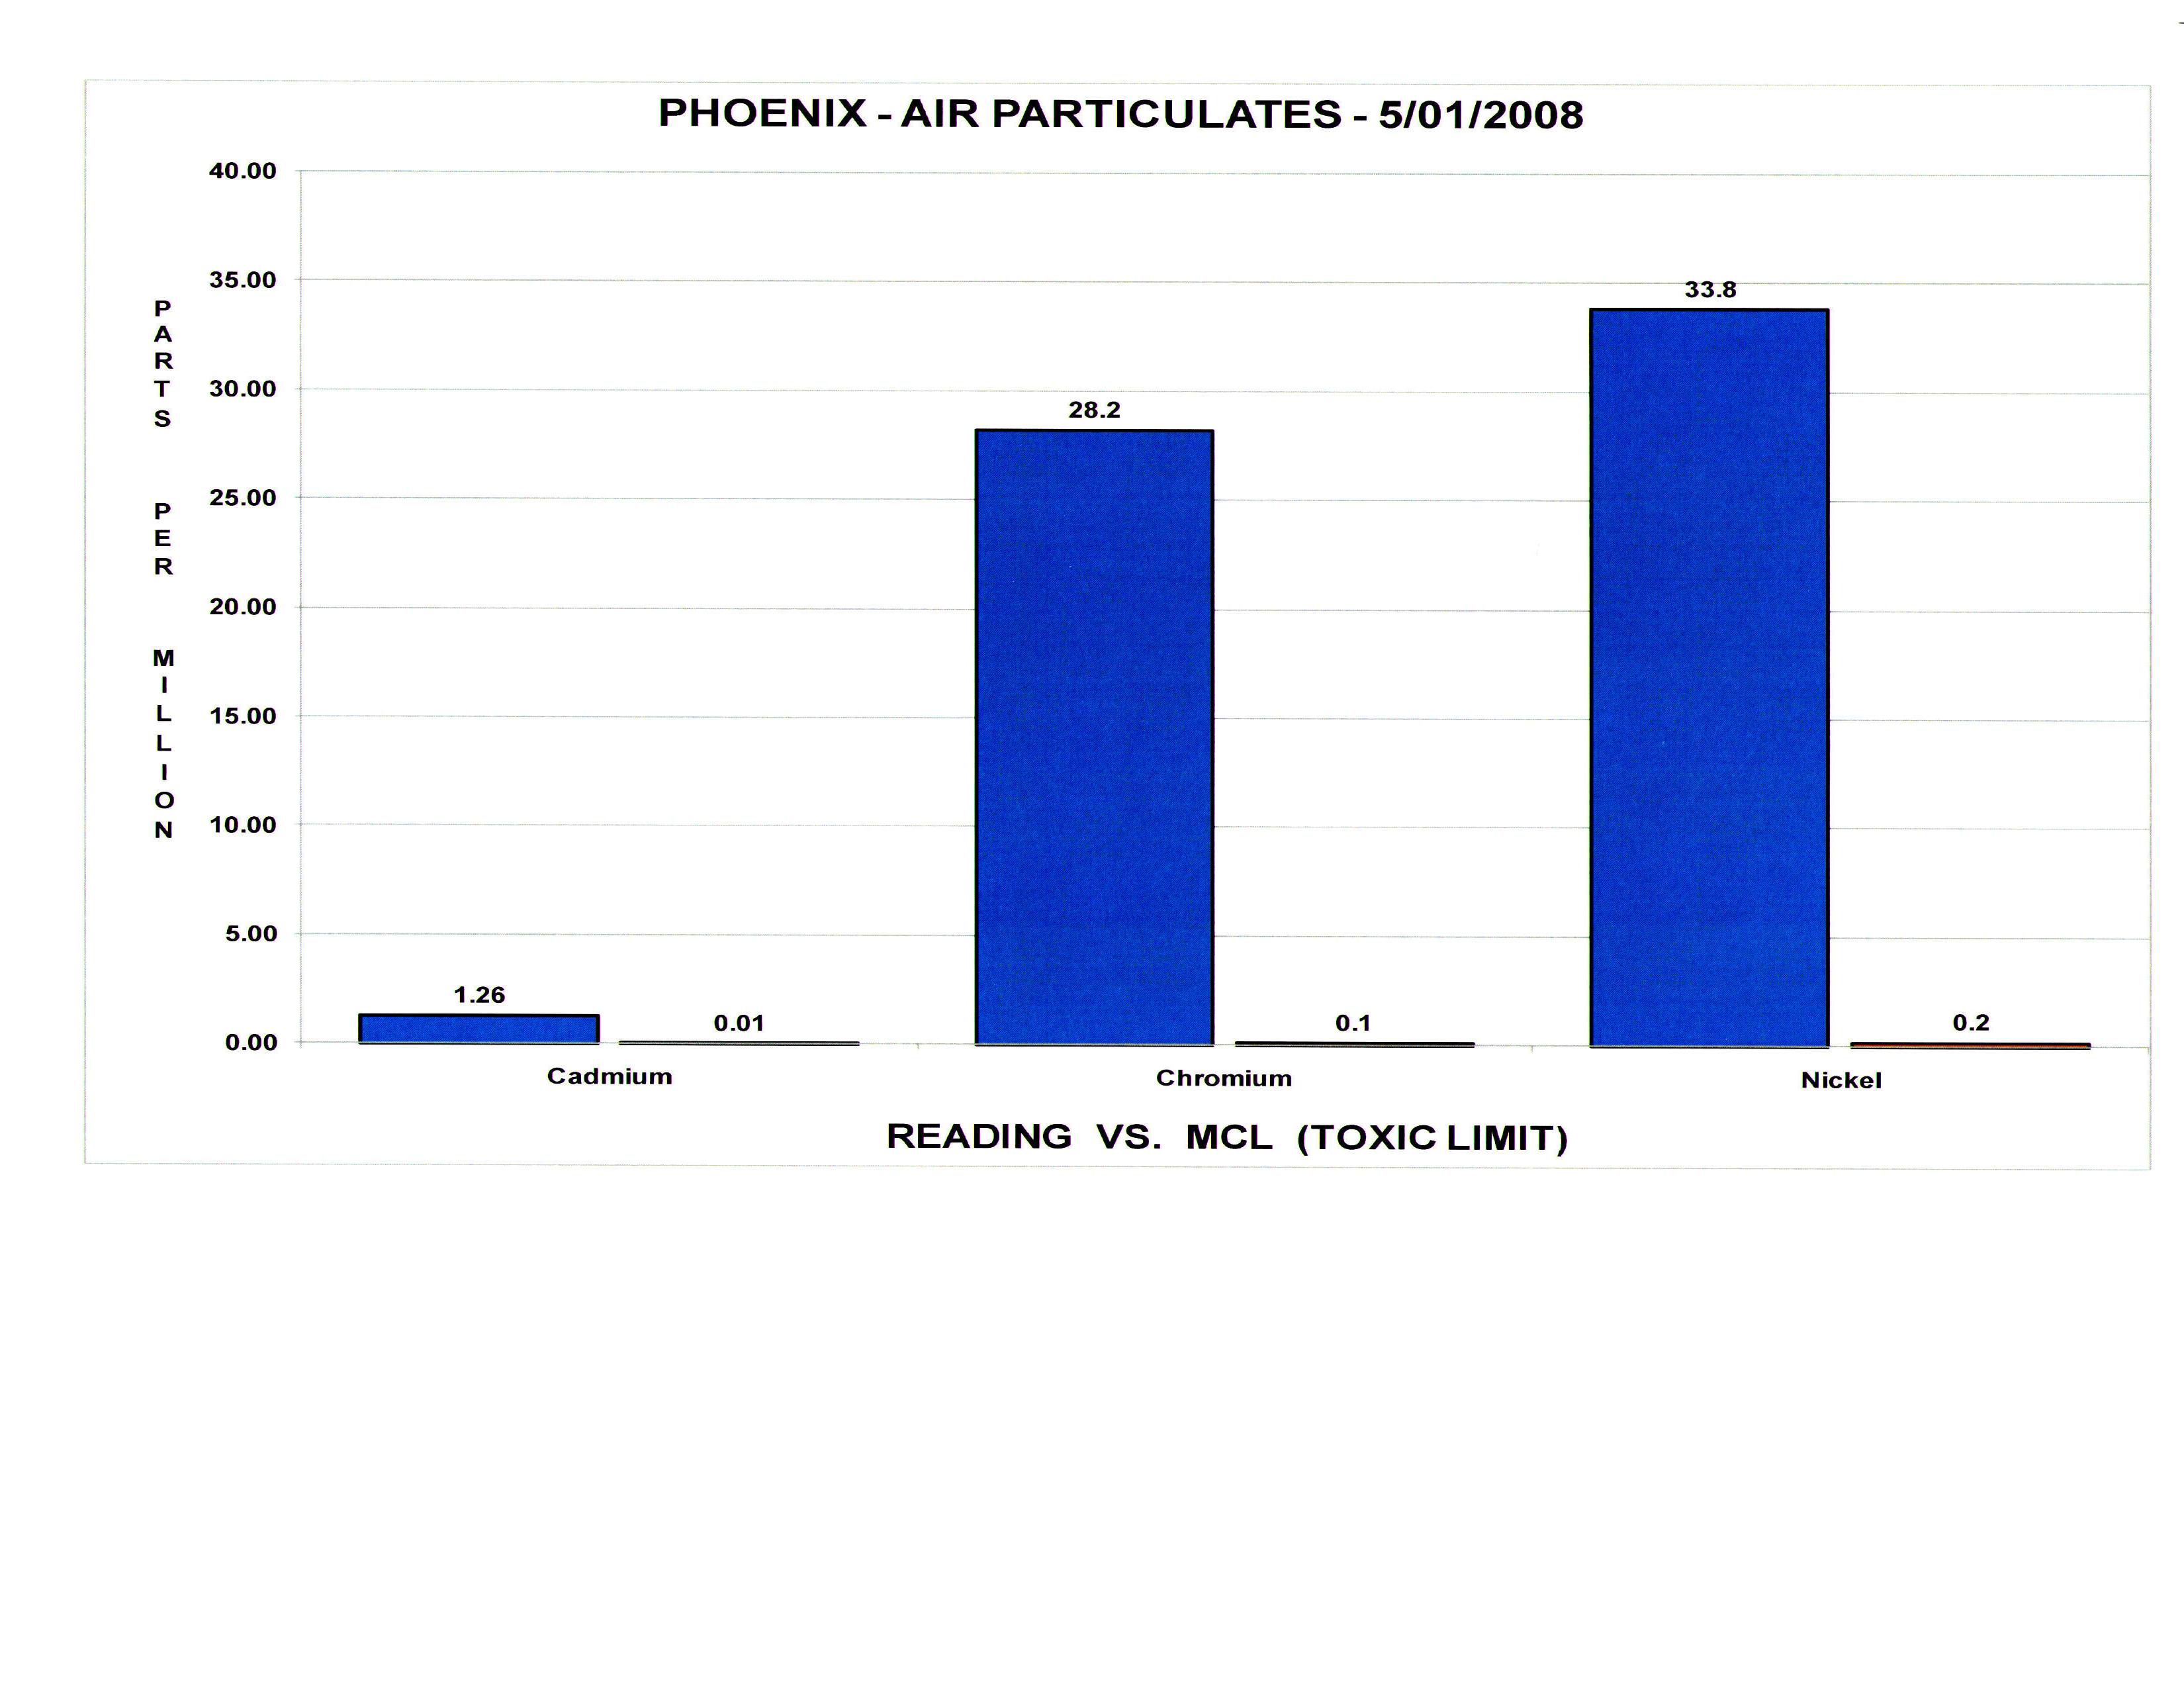
Phoenix Air Particulates Lab Report - 2008
Here are pictures of some of these readings, comparing them to the Maximum
Contaminant Levels, or toxic limits,
|